


INTRODUCTION
Children's health monitoring and surveillance are essential in primary healthcare clinic services for targeting vulnerable groups that need specific attention. Small for gestational age (SGA) infants are infants who were born with a birth weight below the 10th percentile relative to their gestational age. SGA infants are known to have a higher risk of developing adverse health outcomes later in life [1]. Globally, an estimated 32.4 million SGA infants are born in low- and middle-income countries. India recorded the highest incidence of SGA births, accounting for 46.9% of SGA infants globally [2]. In Malaysia, the percentage of SGA infants born is approximately 17.2%[3]. Even though that figure is lower than the global average, it remains an important public health concern that requires further attention. SGA is always reported as a mixed condition comprised of intrauterine growth retardation and low birth weight. SGA status in infants is associated with many short-and long-term adverse health outcomes. SGA infants face an increased risk of mortality and morbidity due to conditions such as neonatal asphyxia and lung dysfunction [4]. In early life, SGA infants are also at high risk for prolonged mechanical ventilation support, postnatal steroid use, and growth failure, all of which can lead to potential developmental delays [5].
Due to recent technological advancements in the healthcare system, high-risk pregnancies have become safer, which has led to a higher survival rate of SGA infants [6]. Advancements in medical technology have also improved the survival rate of SGA infants and their likelihood of catching up to achieve normal growth, in some cases within the first 6 months of life [1,6]. Child malnutrition is still a major public health concern in the 21st century, and a global growth monitoring programme was launched to combat this issue and ensure the healthy growth and development of children worldwide. The programme stipulates that children's body weight, length/height, and head circumference must be measured routinely to evaluate their growth. The nutritional status of infants is examined by plotting the measurements on a growth chart referring to z-score measurements, and the indexes measured are weight-for-age, weight-for-length, length-for-age, and bodymass-index-for-age [7]. Evidence has shown that SGA infants typically experience catch-up growth from 6 months to 2 years of age, but they are also at a high risk of developing a short stature in later life [1,5,6,8]. Catch-up growth is measured and identified using infants' lengths according to the following metrics: 1) length/height measurements that change from less than -2 standard deviation (SD) to more than -2 SD over a certain time period, 2) length measurements that increase by more than 0.67 SD over a certain time period, 3) length measurements greater than the third percentile across any time period, or 4) length measurements that exceed 1.33 SD [8]. Studies have found that infant growth can be influenced by foetal, maternal, paternal, and environmental factors. It is commonly known that low birth weight can predispose infants to malnutrition later in life [9]. However, the relationship between SGA and malnutrition and its effects on the growth and nutritional status of infants in later life has not been studied extensively. Other factors such as maternal age, comorbidity, nutritional status, and height influence infants' birth weights, and postnatal infant growth play an essential role in determining the growth patterns of SGA infant survival [9,10]. Other paternal factors, including body mass index, height, and smoking habits, have been found to influence the nutritional status of non-SGA infants, but the same effects were not observed in SGA infants [11]. According to the United Nations International Children's Emergency Fund (UNICEF) [12], the prevalence rates of stunting and wasting in children below the age of 5 worldwide were 22.0% and 6.7%, respectively, while in Malaysia they were 20.7% and 11.5% [13]. SGA status in infants increases the risk of malnourishment in later life. However, there have been few studies to examine the nutritional status of SGA infants. In many medical contexts, this group of infants is classified as normal or healthy, especially in primary care settings, including in Malaysia. However, it is known that SGA infants have a high risk of adverse health effects. Environmental influences on the nutritional status of infants include socioeconomic factors such as maternal-paternal education, occupation, and household income [9,10]. The growth patterns and nutritional status of SGA infants compared to non-SGA infants have not been examined in-depth, especially in Asia. Factors that contribute to the growth of SGA infants vary by country according to its performance in terms of public health status. A study conducted by UNICEF in 2018 found that the prevalence rate of malnourishment in children above 5 years of age in an urban area in Malaysia was higher than that of the country overall [14]. This is likely due to unfavorable socioeconomic factors that affect low-income, urban-dwelling residents. Therefore, it is crucial to determine if the nutritional status of SGA infants in the first year of life contributes to malnutrition in urban areas in Malaysia. As of the time of this study, there have been few studies to examine the growth patterns and nutritional status of SGA infants who live in low-income, urban settings.
Malaysia is a developing country that has made remarkable achievements in maternal and children's health. However, changes in the economic landscape and population of the country might affect trends related to children's health. Routine evaluations of the nutritional status of children are usually conducted collectively (sent from the primary care level to headquarters) and yield non-specific results, especially related to high-risk groups such as SGA infants. Therefore, this study aimed to identify the growth patterns and nutritional status of SGA infants in their first year of life in urban areas in Malaysia. This study aimed to assess the nutritional status of children, especially those born as SGA infants in Malaysia, to evaluate outcomes related to the ongoing growth monitoring programme. We hypothesised that there would be significant differences in the growth patterns of SGA infants and nonSGA infants in the first year of life as well as in some of the factors (infant, maternal, paternal, or other) associated with nutritional status (weight-for-age/length-for-age).
METHODS
Ethics statement: This study was approved by the institutional review board of the Medical Research and Ethics Committee, Ministry of Health of Malaysia (No NMRR-19-426-46153) and University Kebangsaan Malaysia (No. JEP-2019-283). Informed consent was obtained from the participants.
1. Study Design
A prospective cohort study was conducted to examine data on infants born between January and December 2019 in two districts that contained high-population urban areas.
2. Study Setting and Sample
In Malaysia, every child is required to undergo follow-up growth monitoring at primary-care child health clinics. Infants who attended the selected clinics for their follow-up assessments were recruited from the clinic visit attendance list. The study was conducted in Greater Kuala Lumpur, Malaysia, which is an urban setting. In Malaysia, government health clinics are open to everyone and free of charge for maternal and children's health services. For the present study, the enrollment of subjects began in March 2019. Any infants who were born in January 2019 had to be at least 3 months old at the point of enrollment. The respondents were routinely monitored until their follow-up assessment at the age of 12 months. The recruitment process continued until the desired sample size was achieved. Two subdistricts were chosen randomly, and all primary-care clinics within the chosen subdistricts were selected for inclusion in this study. Selection criteria included if infants were Malaysian citizens, born of singleton pregnancies, had no congenital diseases, and had accessible health records, and if the mother's antenatal health records were also accessible.
The sample size was calculated using Epi Info 7 (version 7.2.2.2). Based on previous studies [15], a 76.5% prevalence rate of infants with healthy weights, a 1.2% prevalence of underweight infants, a 95% confidence interval (CI), and a power of .80, the required sample size was 172. However, the total target sample size at the time of the study's commencement was doubled to 344 infants to account for potential dropouts who were unable to complete a follow-up after 12 months (Figure 1). Two non-SGA infants were recruited for every SGA infant who was recruited, for a ratio of 1:2 SGA infants to non-SGA infants. This study defined SGA infants as infants with a birth weight that was below the 10th percentiles on the Fenton growth charts [16]. All infants included in the study were categorised into 2 groups (SGA infants and non-SGA infants). The researcher routinely followed up with the subjects until they reached the age of 1 year old.
3. Ethical Considerations
Ethical approval for this study was obtained from the Medical Research and Ethics Committee, Ministry of Health of Malaysia and the University Kebangsaan Malaysia Research Ethics Committee.
4. Measurements and Data Collection
The independent variables included in the present study were grouped into 4 categories: 1) infant factors (sex, birth weight, and gestational age), 2) maternal factors (age, ethnicity, height, miscarriage history, parity, marital status, occupation, education, and antenatal morbidity [anaemia, gestational diabetes mellitus, hypertensive disorder in pregnancy]), 3) paternal factors (occupation), and 4) other factors (feeding type, frequency of antenatal follow-up, and gestation week at first antenatal booking). The outcomes of interest were the growth patterns and nutritional status of SGA infants. Growth patterns were based on infants' anthropometric measurements (weight, length, and head circumference) corresponding to their ages. Midwives and nurses from the health clinics performed the assessments and monitoring based on anthropometric measurements and reported health issues for each visit [17]. The anthropometric data (weight, length, and head circumference) were taken using an infant scale and measuring tape at each visit according to standard procedures [17]. Next, the researcher collected the data (weight, length, and head circumference at the 1-month, 3-month, 6-month, and 12-month visits) by reviewing the health records of the infants and mothers (entered by the nurses).
The anthropometric measurements were converted into z-scores to determine the nutritional status of the infants using World Health Organization (WHO) Anthro version 3.2.2 to obtain the weight-for-age z-scores (WAZ) and length-forage z-scores (LAZ) [18]. Nutritional status was classified according to WAZ and LAZ. Based on the 2006 WHO growth chart, possible nutritional statuses based on WAZ were <-3 SD for severely underweight, between ≥-3 SD and <-2 SD for underweight, ≥-2 SD and ≤1 SD for normal weight, and >1 SD to >3 SD for overweight. Possible nutritional statuses based on LAZ were <-3 SD was severe stunting, between ≥-3 SD and <-2 SD for stunting, between ≥-2 SD and ≤3 SD for normal length, and >3 SD for tall [7]. WAZ was classified as either underweight or non-underweight in the sub-analysis stage, and LAZ was categorized as either stunting or nonstunting for multivariate analysis.
5. Data Analysis
The subjects' characteristics and nutritional status were indicated as percentages and frequencies. The t-test and x2 test were used to assess the differences in the characteristics of SGA and non-SGA infants. The Friedman test and MannWhitney test were performed to identify the growth patterns of the infants and the differences between the SGA and nonSGA groups. Sub-analysis (among SGA infants) using multiple logistic regression was performed to identify the factors that influenced the nutritional status of SGA infants. Univariate analysis revealed that independent variables with p<.250 were added in multivariate analysis [19]. All variables with p<.250 in univariate analysis were included in the multiple logistic regression for determining the factors that influenced nutritional status (weight-for-age: <-2 SD indicated underweight, ≥-2 SD indicated non-underweight; length-for-age: <-2 SD indicated stunting, ≥-2 SD indicated non-stunting). The forward likelihood ratio method was selected for statistical modelling. The interaction and multicollinearity were evaluated for the final model for WAZ and LAZ at 1 month, 6 months, and 12 months. The variance inflation factor for each model was less than 10, thus confirming the absence of multicollinearity in the model. The data were analysed using SPSS software version 22 (IBM Corp., Armonk, NY, USA).
RESULTS
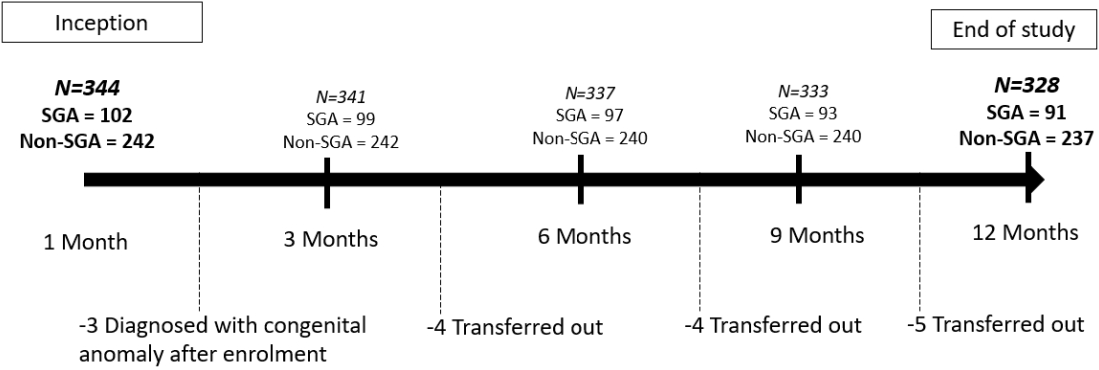
Among the 344 infants enrolled in the study, there was an attrition rate of 4.65% by the end of the 12-month follow-up period, as shown in Figure 1. Subjects who transferred out during follow-up to another non-participatory clinic in the study setting were excluded. Subjects who were diagnosed with a congenital disease after being recruited into the study were omitted. A total of 328 infants were included in the final analysis. Of those, 27.7% were SGA infants (Table 1).
1. Infant and Maternal Characteristics
More than half of the infants were male, and there were more male SGA infants (54.9%) than females. In total, 70.3% of SGA infants had a low birth weight. However, only 4.4% of the SGA infants were born prematurely. Significant differences were found between SGA and non-SGA infants' birth weights (t=16.59, p<.001) and gestational ages (x2=13.34, p<.001). Significant differences were also observed between SGA and non-SGA infants with regard to anthropometric measurements taken at 12 months (mean weight, length, and head circumference). Infant weight measurements at 12 months showed that most SGA infants (29.7%) were severely underweight. Infant height measurements at 12 months indicated a high prevalence of stunting among the SGA group (24.2%). Other characteristics that showed no significant differences between the 2 groups are shown in Table 1.
2. Differences in the Growth Patterns of SGA and Non-SGA Infants from Birth to 12 Months
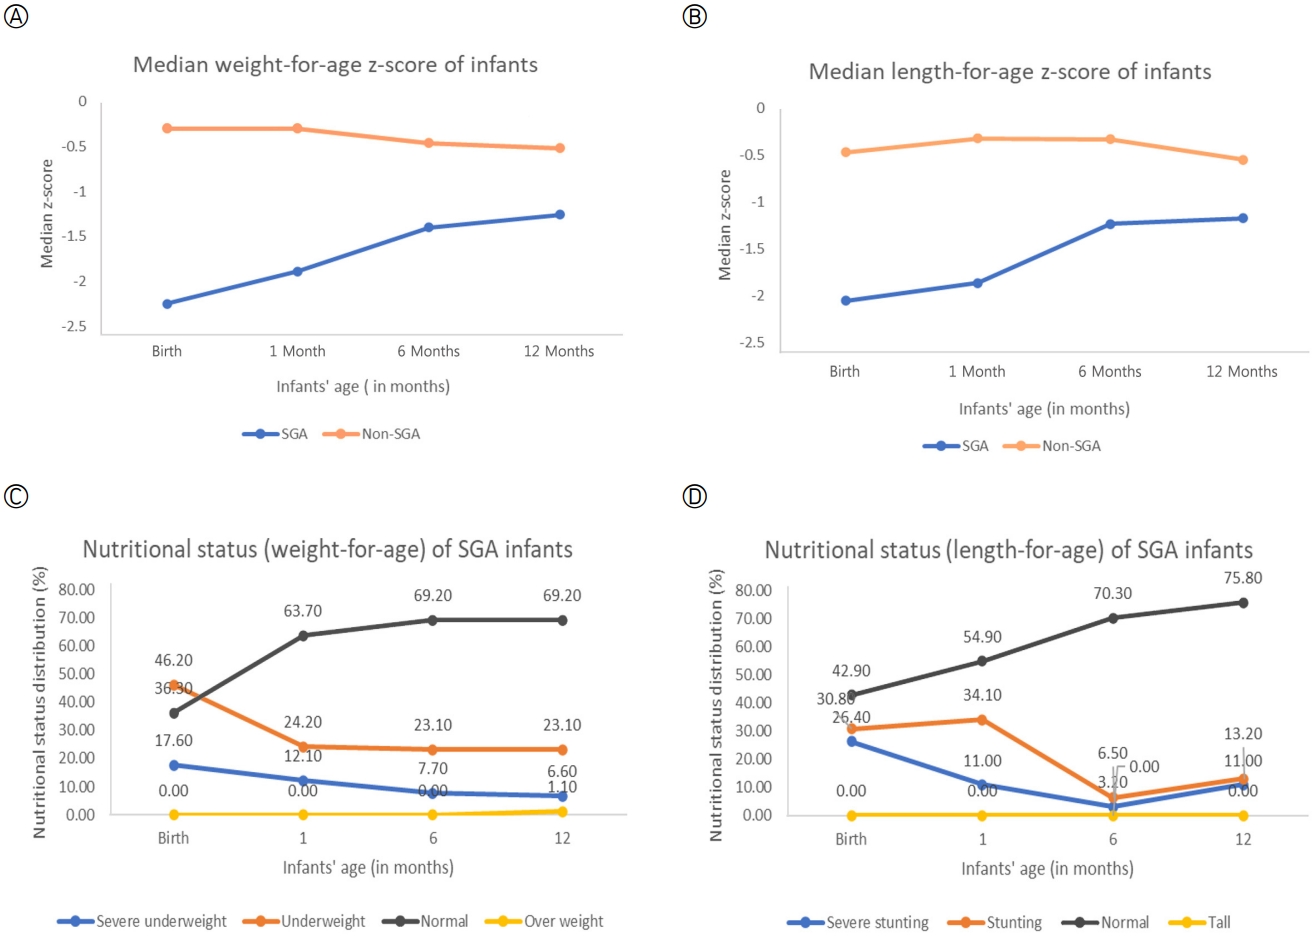
Table 2 shows the growth patterns of SGA and non-SGA infants until the age of 12 months old. We plotted the median WAZ and LAZ of the infants at birth, 1 month, 6 months, and 12 months to visualise the growth changes between groups (Figures 2-A, 2-B). The graph shows a lower median z-score for SGA infants than non-SGA infants for both indicators (WAZ and LAZ). However, differences in the median z-scores by age were more prominent in the SGA group, especially from 1 to 6 months. Furthermore, it was found that both groups of infants were healthy, based on anthropometric measurements (weight, length, and head circumferences). There was a significant growth increment in both groups, with Fweight= 1,636.9 (p<.001), Flength=1,585.8 (p<.001), and Fhead circumferences=1,563.7 (p<.001). The results of the Mann-Whitney test showed a significant difference in the growth patterns of SGA infants compared to non-SGA infants, with Uweight= 1,207.5 (p<.001), Ulength=3,964.5 (p<.001), and Uhead circumferences=3,023.0 (p<.001) (Table 2). Figures 2-C, 2-D demonstrate trends in SGA based on infants' nutritional status from birth to 12 months old by weight for age and length for age. The nutritional status of the SGA infants appeared to improve from birth to 12 months. The percentage of infants with a WAZ of <-2 SD decreased from 63.8% at birth to 29.7% at 12 months, and the percentage of infants with an LAZ of <-2 SD also decreased from 57.2% at birth to 24.2% at 12 months. These metrics indicate that the SGA infants were generally healthy by the time of their 12-month follow-up assessments.
3. Factors that Influenced the Nutritional Status of SGA Infants
Birth weight and sex had a significant influence on the nutritional status (underweight/stunting) of SGA infants up to 12 months old (Table 3). The final model determined the factors that influenced the nutritional status of SGA infants at 1 month, 6 months, and 12 months of age. SGA infants with a birth weight of <2.5 kg had a higher risk of being underweight at 1 month of age (adjusted odds ratio [OR]=11.74, 95% CI=2.57-53.77, p=.002) and 6 months of age (adjusted OR=6.31, 95% CI=1.64-24.32, p=.007) compared to SGA infants with a birth weight of ≥2.5 kg. In contrast, male SGA infants had a higher risk of being underweight than female SGA infants at the ages of 6 months (OR=4.27, 95% CI=1.51-12.07, p=.006) and 12 months (adjusted OR=5.44, 95% CI=1.81-16.38, p=.003). For LAZ, SGA infants with a birth weight less than 2.5 kg showed a higher risk of being stunted at 1 month old (adjusted OR=25.47, 95% CI=5.22-124.38, p<.001) and 6 months old (adjusted OR=6.62, 95% CI=1.59-27.36, p=.009) compared to SGA infants with a birth weight of ≥2.5 kg. Male SGA infants had a higher risk of being stunted than female SGA infants at the ages of 1 month (adjusted OR=3.51, 95% CI=1.27-9.68, p=.015), 6 months (adjusted OR=9.20, 95% CI=2.68-31.51, p<.001), and 12 months (adjusted OR=5.66, 95% CI=1.69-19.04, p=.005).
DISCUSSION
This study aimed to identify and examine the growth patterns, nutritional status, and associated factors of SGA infants in Malaysia. SGA occurrence in this study was 27.7% compared to the 17.2% prevalence rate reported in a Malaysian study from 2014 that used hospital data [3]. This difference is likely because our study was conducted in primary healthcare facilities as a prospective cohort study, whereas the previous results came from a cross-sectional study conducted in a tertiary setting with a larger sample size. In addition, the discrepancies in these findings may also have been due to the different definitions used to categorise SGA infants [20]. In standard practice in Malaysia, the risk of giving birth to an SGA infant is determined based on the mother's history of delivering SGA infants, poor progression of symphysial fundal height, or poor maternal weight gain as assessed by clinicians at primary healthcare facilities and intrauterine growth restriction as determined by an ultrasound examination in the hospital setting. However, not all deliveries took place in a hospital setting. Therefore, we recategorised SGA infants postnatally for the present study by plotting their birth weights on the Fenton growth chart. Regardless of the definitions used and prevalence rate, monitoring SGA infants at primary healthcare facilities remains essential. The anthropometric measurements of all the infants were analysed based on the z-scores from the WHO 2006 Growth Standards [7]. However, in practice, especially in the tertiary setting, premature infants are usually monitored using other tools such as the Fenton growth chart until the second year of the corrected age [16]. However, since data collection in this study was conducted in the primary care setting, all of the infants' anthropometric measurements were routinely plotted based on the WHO 2006 Growth Standards [17].
We found that both groups of infants showed promising growth. However, more significant differences in the median z-scores of SGA infants were observed. A previous study found that infants with low birth weights experienced faster growth than infants with high birth weights [21]. No clear conclusion can be drawn regarding whether this difference can be attributed to infants' birth weights or to abnormal levels of growth hormones and insulin-like growth factor found in SGA infants. These factors may contribute to an increase in fat mass rather than lean mass [22]. However, in terms of nutritional status, there were no SGA infants with an LAZ score of >3 SD at any age between 0 and 12 months in this study. This finding could indicate a lack of rapid catch-up growth among the SGA infants in this study [8]. However, our study found significant changes in the median z-scores of SGA infants between the ages of 0 and 6 months. We postulate that the growth of the SGA infants could have been promoted by some factors based on the theory of development that there is more adipose tissue in smaller babies [22]. However, until the age of 12 months, significant differences in growth patterns were observed between the two groups, indicating that SGA infants may have a smaller size in general than non-SGA infants.
Nevertheless, a national survey found that the prevalence of underweight among infants aged 0-5 months was 16.6%, and it was 17.3% among infants aged 6-12 months. In addition, the prevalence of stunting among infants aged 0-5 months was 23.2%, while it was 15.5% among infants aged 6-12 months [13]. However, the survey did not report the prevalence rates of SGA infants' various nutritional status metrics. The present study is important due to the finding that almost 30% of SGA infants at the age of 6 months and 29% at the age of 12 months were underweight. Almost 30% of SGA infants at 6 months and 25% at 12 months were stunted. This finding gives a clearer picture of the nutritional status of SGA infants and requires further evaluation.
1. Factors that influenced the nutritional status of SGA infants
Previous studies from the past few decades have found that infant growth can be influenced by foetal, maternal, paternal, and environmental factors. For example, low birth weight can predispose infants to malnutrition [9]. Maternal age, comorbidity, nutritional status, and height influence infants' birth weights and postnatal infant growth. In addition, infants are also affected by paternal factors, including body mass index, height, and smoking habits [11]. Environmental influences include socioeconomic factors such as maternal-paternal education, occupation, and household income [9]. However, in this study, the nutritional status of SGA infants (WAZ and LAZ) was found to be influenced only by infant factors (birth weight and sex). Birth weight influenced the WAZ and LAZ at 1 and 6 months. Infant sex influenced the WAZ of SGA infants at 6 and 12 months and the LAZ at all ages. Previous studies have found that infant birth weight strongly influenced the nutritional status of infants and their growth after birth and during the early stages of childhood development [9,23]. Therefore, we emphasise the importance of nutritional care by pregnant mothers via various worldwide health promotion programmes-a vital strategy for ensuring that babies are born at a healthy weight to ensure their survival after birth and healthy growth in the next period of life.
In addition, our study found that sex influenced the nutritional status of infants at 12 months of age. Sex, however, is a non-modifiable biological factor. Biologically, boys and girls experience physical growth and developmental differences as early as the intrauterine period in the womb [24]. Recent studies have also found that baby boys and girls responded differently to breastfeeding and nutrition early in their lives [25]. In this study, we found a higher probability of underweight and stunting problems among male SGA infants. Male infants often have greater nutritional needs, thus posing a greater challenge for achieving optimal growth, although no studies have proven that male infants require a higher caloric intake [26,27].
In this study, we conducted analyses of SGA infants at the ages of 1 month, 6 months, and 12 months due to the significant milestones associated with each of these stages. For example, exclusive nursing is typically recommended until the age of 6 months old. However, exclusive breastfeeding did not affect the nutritional status of infants at the ages of 1 and 6 months in this study, which corresponds to the findings of a study from Indonesia [28]. A few possible reasons for this included improper nursing (poor infant attachment), infrequent breastfeeding, a short breastfeeding duration (less than 8 to 10 minutes), infant discomfort, or an insufficient amount of breast milk. However, many evidence-based public health studies and systematic reviews have documented the benefits of exclusive breastfeeding for disease prevention and promoting mother-child bonding when the primary care provider emphasises its benefits and counsels mothers appropriately. Nonetheless, breast milk remains the best nourishment for infants. Thus, the practice of exclusive breastfeeding is highly recommended and emphasised.
Furthermore, maternal factors (age, occupation, education, weight at the time of enrollment, height, obstetric history, comorbidity, parity, marital status), paternal occupation, and other factors (feeding type, type of delivery, frequency of antenatal follow-up, and gestation week at first antenatal booking) had no significant impacts on the nutritional status of SGA infants in this study. The present study collected data from an urban-dwelling population. The characteristics of the study population as well as the use of a different definition of SGA may have influenced the study outcomes and resulted in discrepancies from earlier findings. Therefore, a standardised and customised growth chart according to sex and the population is required for improving the ability to compare future findings.
To combat malnutrition issues and provide high-quality healthcare to the population of Malaysia, the Malaysian government created a comprehensive list of nutritional needs throughout one's life cycle. The health education information includes: 'The First 1000 Days' programme, nutritional surveillance of pregnant women and infants, nutrition education for mothers, breastfeeding promotion, providing supplements for pregnant and lactating mothers, and growth monitoring [29]. All children are required to attend health and growth monitoring follow-up assessments at primary care clinics. However, the current record-keeping system, which is primarily composed of health book records containing manually-entered data, leads to inadequate evaluation of service outcomes, especially when evaluating the outcomes based on different demographic groups of children such as SGA infants.
To the best of our knowledge, this is the first cohort study in Malaysia on the growth patterns and nutritional status of SGA infants. Since this study was conducted among urban-dwelling subjects, the results can provide vital information to health authorities on the growth patterns and nutritional status of infants among the urban-dwelling population, which has a high rate of malnourishment among children, as highlighted by a recent UNICEF report [14]. However, the 1-year data collection period took place during the coronavirus disease 2019 pandemic, which affected the completeness of the data. Researchers were only able to collect data from health records rather than by meeting and examining subjects in person. In addition, since the data sources were limited to infant and maternal health records, many other factors that potentially influence the nutritional status of infants could not be studied.
Furthermore, this study did not discuss the nutritional status of SGA infants using corrected age (CA). The importance of using CA for making growth assessments about SGA, low birth weight, and premature infants has been reported in earlier studies [30]. Despite these limitations, the present study still provides valuable findings related to SGA infant monitoring.
CONCLUSION
In general, SGA infants in urban areas of Malaysia demonstrated proper growth during the first year of life. However, poor nutritional status was found to be higher among SGA infants than non-SGA infants. Therefore, it is vital to strengthen the components of various maternal and child health programmes to empower mothers of infants with low birth weights to routinely monitor the well-being of their children. In addition, sex-based child nutritional advocacy is crucial for preventing poor nutritional status in SGA infants, which is prominent among boys. In the future, we recommend conducting a larger-scale study that uses a validated questionnaire, meets the respondents on an in-person basis, and collects data from a digital system for better results.